
Figure 1.
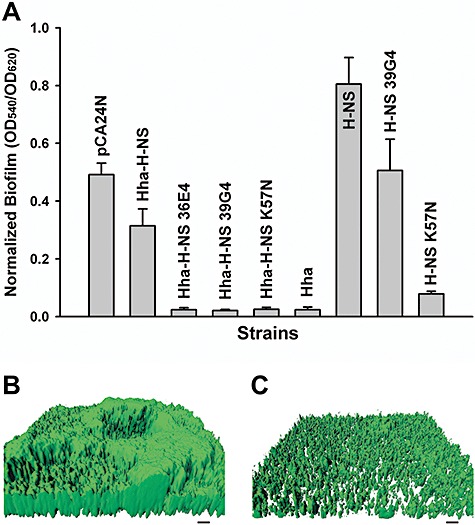
Biofilm formation with H‐NS variants. Normalized biofilm formation for BW25113 hha hns cells producing the Hha–H‐NS variants from pCA24N using 1 mM IPTG in 96‐well polystyrene plates in LB at 37°C after 24 h (A). Hha and H‐NS amino acid substitutions are shown in Table 1 for Hha–H‐NS 36E4, Hha–H‐NS 39G4 and Hha–H‐NS K57N. Hha–H‐NS indicates simultaneous expression of both wild‐type Hha and H‐NS; Hha and H‐NS indicate wild‐type proteins expressed individually; H‐NS 39G4 indicates expression of H‐NS with H‐NS amino acid substitution taken from Hha–H‐NS 39G4; and H‐NS K57N indicates expression of H‐NS with the K57N substitution. Each data point is the average of at least twelve replicate wells from two independent cultures, and one standard deviation is shown. Biofilm formation of BW25113 hha hns cells producing wild‐type H‐NS (B) and H‐NS K57N (C) from pCA24N using 1 mM IPTG on glass in flow cells after 48 h in LB medium. Scale bars represent 10 µm.