
Figure 4.
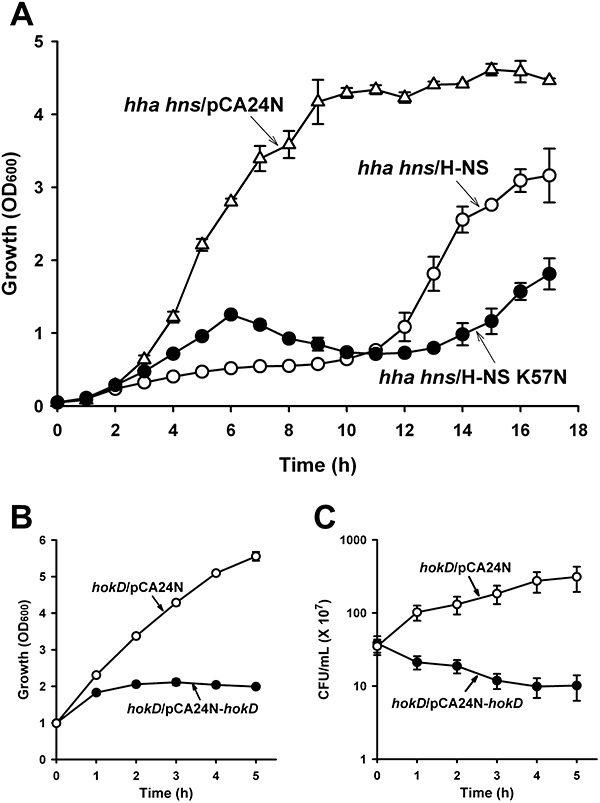
Growth during expression of H‐NS K57N and toxicity of HokD. Growth in LB at 37°C for BW25113 hha hns cells producing H‐NS K57N (hha hns/H‐NS K57N) and wild‐type H‐NS (hha hns/H‐NS) using 1 mM IPTG (A). Growth (B) and cell viability (cfu ml−1) (C) for BW25113 hokD producing HokD (hokD/HokD) using 1 mM IPTG at a turbidity of 1.0 at 600 nm. Each data point is the average of at least two independent cultures.