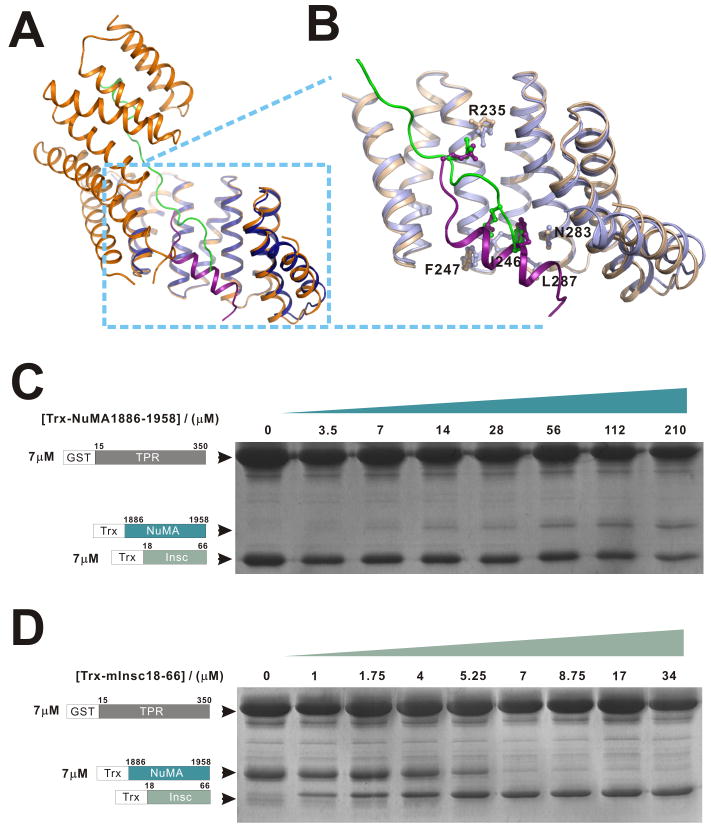
Figure 5. mInsc can displace NuMA from LGN.
(A) Ribbon diagram representation showing the superposition of the LGN/mInsc and LGN/NuMA complexes with the same coloring schemes as in Figs. 1&4. (B) An enlarged view showing the comparison of the LGN/mInsc and LGN/NuMA interfaces. A selected set of amino acid residues, which are in the inter-domain interfaces and share similar positions in the two complexes, are drawn in the stick model. (C) NuMA cannot compete with mInsc in binding to LGN TPR0-7. In this experiment, the total amounts of GST-LGN TPR0-7 and Trx-mInsc were fixed (7 μM), and the concentrations of Trx-NuMA were increased to as high as 210 μM. (D) Sub-stoichiometric amount of mInsc can displace NuMA from LGN. In this experiment, the amounts of GST-LGN TPR0-7 and Trx-NuMA in each assay were fixed at 7 μM, and the concentrations of Trx-mInsc were gradually increased. GSH-Sepharose beads pull-down experiment was used to assay the formations of the LGN/mInsc or LGN/NuMA complexes. Also see Fig. S5 and Fig. S7.

