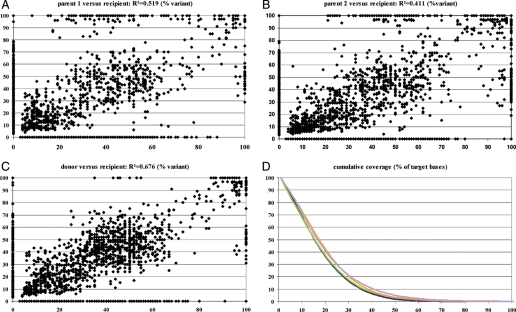
Figure 2.
MHC resequencing results. Variant correlation of parents, donor and recipient. (A–C) Correlating all detected variant positions in percentage of reads per position for two individuals visualize the degree of sequence match. A clear reduction of variant positions is desplayed in (C). (D) Cumulative coverage in percentage of target bases (blue p1, green p2, lila donor, red recipient).

