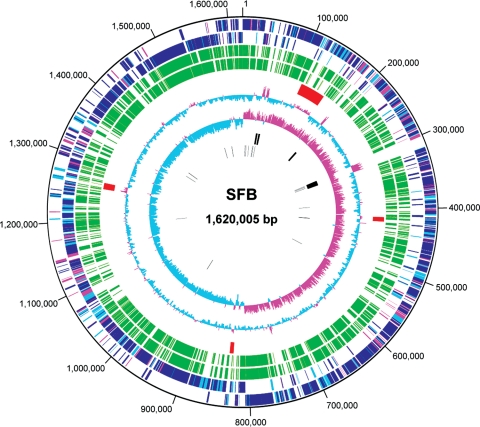
Figure 2.
Circular map of the SFB chromosome. From the outside in: the first circle depicts the nucleotide sequence positions (in bp). The second and third depict CDSs that are transcribed clockwise and counterclockwise, respectively, and CDSs were coloured according to the results of the BLASTP homology search of each CDS (E-value <1e−5) against the RefSeq database at the NCBI (blue, top hit to order Clostridiales; light blue, top hit to other species; red, no hit). The fourth and fifth depict CDSs conserved in C. difficile and C. novyi, respectively (≥25% sequence identity and ≥60% aligned length coverage of a query sequence). The sixth depicts prophages, the seventh GC content, the eighth GC skew, the ninth rRNA operons and the tenth tRNA genes.

