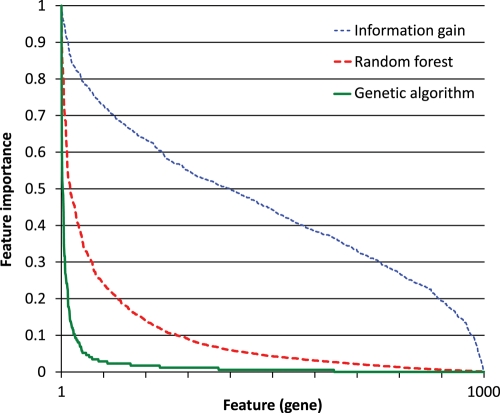
Figure 1.
Feature-importance distribution. Each feature (gene) from the 1000-gene data set was assigned an importance score by each of the three feature selection methods. The scores were scaled to the [0, 1] interval. The features were then sorted by their importance, separately for each method, and their importance was plotted.

