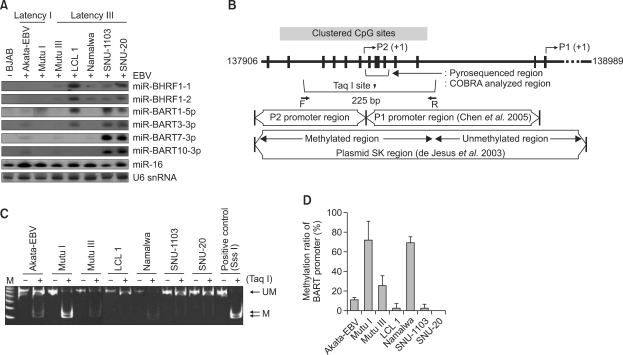
Figure 1.
Inverse relationship between the EBV BART miRNAs expression and the promoter methylation. (A) Northern blot for EBV miRNAs was performed using total RNA isolated from the cells. An EBV-negative B cell line, BJAB, was included as a negative control. Loading amount of each RNA sample was monitored by reprobing the blot using a specific probe to U6 snRNA. The expression of human miR-16 was assessed as a reference. (B) Schematic representation of the CpG-rich region of BARTs promoter (GenBank entry AJ507799). CpG sites are indicated with vertical ticks, Taq I restriction site is indicated with the vertical triangle, and PCR primers for COBRA analysis are indicated with arrowheads. BART promoter regions analyzed previously (de Jesus et al., 2003; Chen et al., 2005) are also shown for comparison. (C) The methylation status of the BART promoter analyzed by COBRA. SNU-719 DNA treated with Sss I methyl transferase was used as a positive control for methylated DNA. (D) CpG methylation of BART promoter region in EBV positive cell lines was assessed by pyrosequencing. The mean ± standard deviation values for individual cell lines shown in Supplemental Data Table S1, are plotted in a bar graph for easy comparison.

