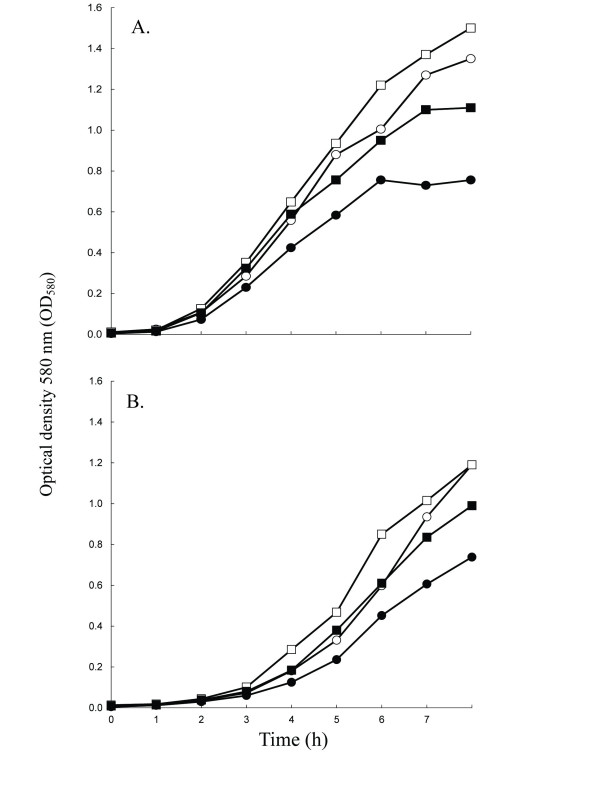
Figure 1.
Growth curve for S. aureus strains SH1000 (panel A) and COL (panel B), and their respective diclofenac reduced-susceptibility (DcRS) mutant strains. Cultures of WT (circles) and DcRS mutants (squares) were grown in TSB with (filled plots) or without (empty plots) 80 μg/ml diclofenac. The mean optical density is plotted as a function of time for three independent cultures and varied by less than 5%.

