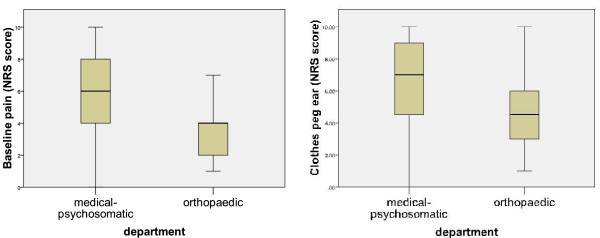
Figure 3.
Pain Characteristics of the Two Clinical Groups. Our aim was to compare the two algometric test methods in a wide range of pain types. Therefore we recruited patients from the orthopaedic department and the medical-psychosomatic department. a illustrates the distribution of the baseline pain values (NRS) in both groups. b illustrates the distribution of the pain sensitivity values (NRS) of the ear lobe provoked by clothes pegs. The box-and-whisker-plots show the median with interquartile range (box: 25th and 75th percentile) and 5th and 95th percentile (whiskers) of the data distribution.

