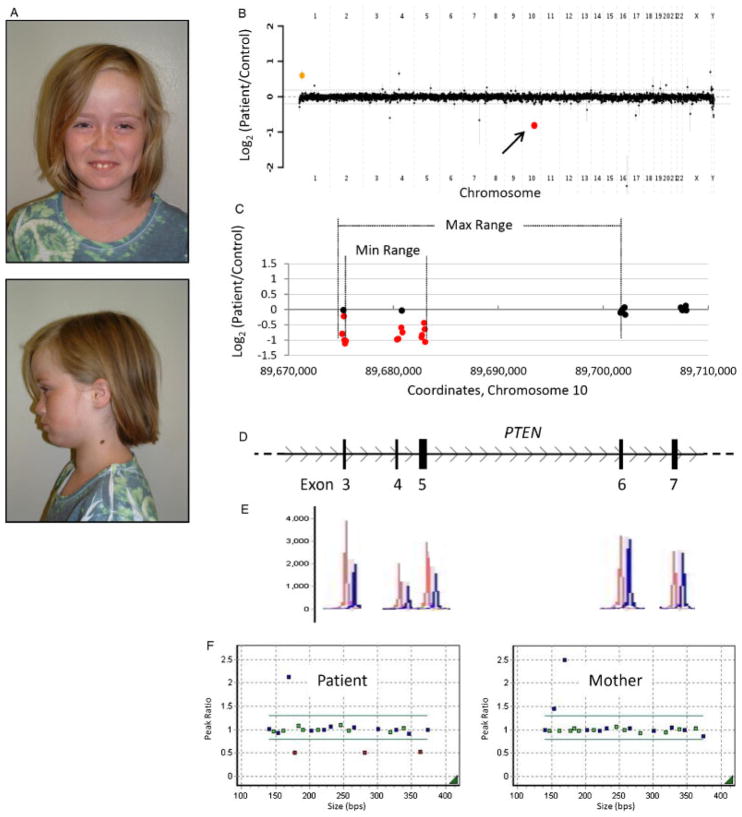
Figure 3.
Patient 2 with an intragenic deletion in PTEN. A: Photos of patient 2, a 9-year-old female with features of Bannayan-Riley-Ruvalcaba syndrome. B: Genome-wide view of aCGH data. The red point (arrow) indicates the copy-number loss of interest (PTEN). The orange point indicates known benign copy-number variation (CNV). C–D: Local view of the PTEN intragenic deletion. These graphics are aligned with one another. C: Plot of individual array probes, from which a “Min Range” and “Max Range”—defining the minimum and maximum expected boundaries of the deletion, respectively—can be established. D: Genomic map of this region of PTEN. E: MLPA trace confirming a deletion of exons 3–5. Control traces are in red, patient traces in blue. Each has been aligned to the exon it interrogates. F: Dot plots displaying normalized MLPA results for the patient and mother, demonstrating that this copy-number loss was not maternally inherited. The father declined to be tested. Green probes interrogate exons of PTEN, blue probes are controls, and red probes indicate copy change.

