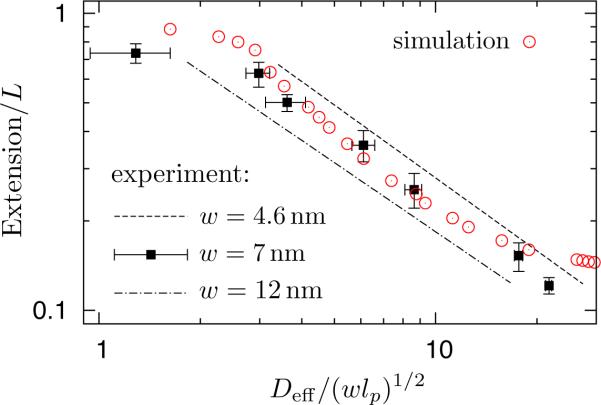
Figure 8.
Comparison of simulation (circle) and experimental data.9 The simulation data correspond to L = 4.12μm, w = 4.6nm and lp = 53nm in a square nanochannel, the same as that shown in Figure 6. The experimental data as a function of Deff = Dav − w were plotted using a persistence length lp = 57.5nm reported by Reisner et al.9 and different values for the effective width: w = 4.6nm (dashed line), w = 7.0nm (squared symbols) and w = 12nm (dash dotted line). For clarity, we only show the best power-law fits to the data for channel sizes ranging from 440nm to 60nm for w = 4.6nm and 12nm, a similar analysis to Reisner et al.9Deff/(wlp)1/2 = 10 corresponds to a real channel dimension of D = 160.7nm for w = 4.6nm and lp = 53nm and corresponds to D = 207.6nm for w = 7.0nm and lp = 57.5nm.

