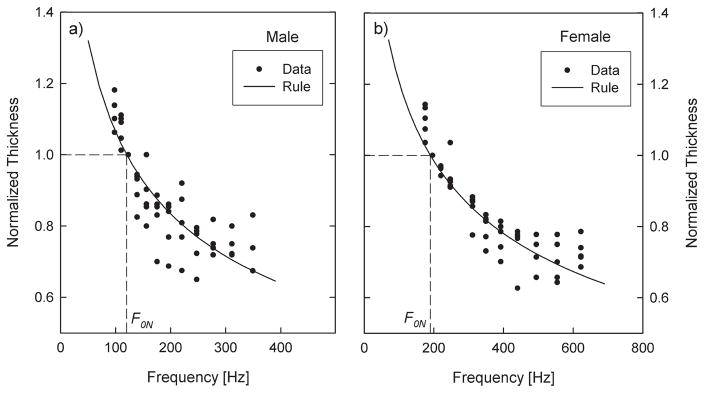
Figure 4.
Change of vocal fold thickness with phonation frequency. The values correspond to data measured from 5 male and 5 female participants using the method of stroboscopic laminagraphy (Hollien & Colton, 1969). To obtain the normalized values, all the measured thickness values were divided by the value measured at the frequency closest to F0N. The normalization was done for each of the participants separately. Falsetto frequencies were not considered. The curves represent the relationships of Equations 17a and 17b.

