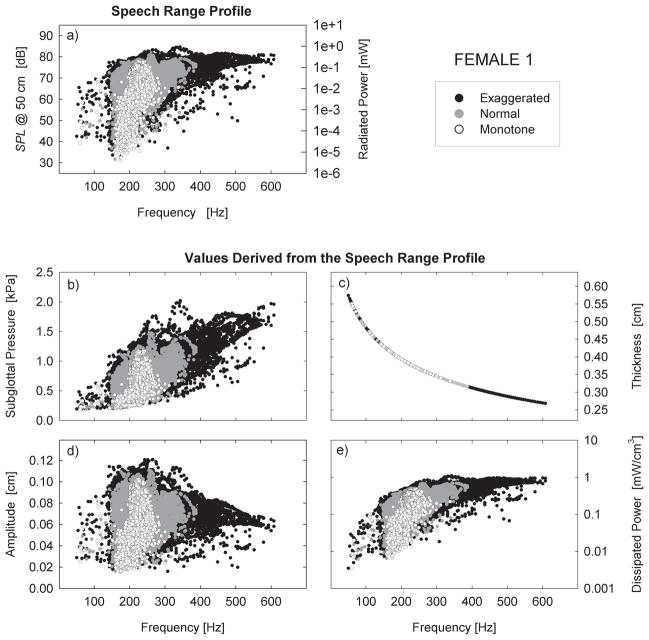
Figure 6.
Monotone (white), normal (gray), and exaggerated speech (black) produced by 1 female (F1) participant. The points correspond to the values measured from single vibratory periods. (a) Speech range profiles; (b) subglottal pressure PL; (c) vocal fold thickness T; (d) vocal fold vibratory amplitude A; (e) dissipated power De. The values in the plots (b–e) are derived from the values in (a) using the rules given in Equations 9 and 14–18.

