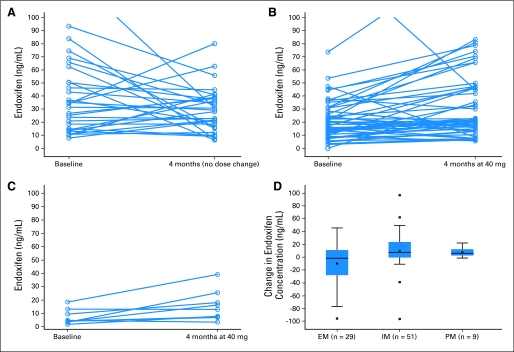
Fig 3.
Endoxifen concentration (ng/mL) change over time, demonstrating (A) no significant difference in extensive metabolizers (EM; P = .25; no dose change); (B) a significant increase (P < .001) in endoxifen after 4 months of increased tamoxifen in intermediate metabolizers (IM); and (C) a significant increase (P = .020) in endoxifen after 4 months of increased tamoxifen in poor metabolizers (PM), although still lower than other groups. (D) Box and whisker plot of change over time of endoxifen concentration by genotype group (EM, IM, PM), demonstrating an increase in endoxifen concentration in the groups with increased dose (IM, PM; P < .001 and P = .020, respectively). The two ends of the boxes indicate the upper and lower quartiles, the median is the middle line, the mean is the hollow square within the boxes, and the whiskers represent the upper and lower fence of the data. Observations outside the fences are identified as outliers with a square. The EM/ultrarapid metabolizer (UM) patient's value lies within the ends of the boxes (between the upper and lower quartiles) for the EM group (change of −17 ng/mL). (A) Value outside the figure for baseline = 126 ng/mL. The EM/UM patient had a baseline endoxifen concentration of 37 ng/mL and a 4-month concentration of 20 ng/mL. (B) Value outside range of figure for 4 months = 170 ng/mL and value outside figure for baseline = 141 ng/mL.

