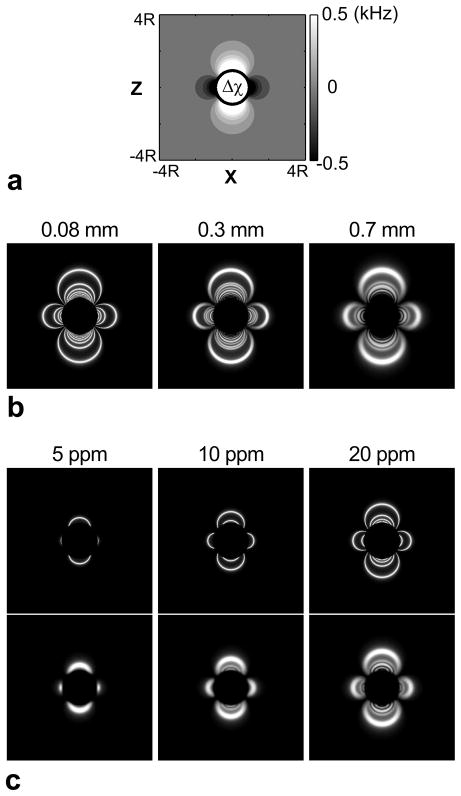
Figure 4.
The three-dimensional magnetic field distribution around of a spherical perturber was simulated along with the corresponding PARTS image for the following parameters: R = 4 mm, a field-of-view (FOV) of 8·R sampled with 400 points in all three directions, Bo = 1.5 T, α = 5°, TRs/TRl = 0.6/4.2 ms, T1/T2 = 5, and Δχ = 5, 10, 20, 30, 40 ppm. a: The cross-sectional map of the local precession frequency for Δχ = 40 ppm in the xz-plane. b: The corresponding PARTS images reconstructed at isotropic resolutions of 0.08, 0.3, and 0.7 mm. c: The PARTS images at 0.08-mm (upper row) and 0.7-mm (lower row) resolution for Δχ = 5, 10, and 20 ppm. The positive-contrast region spatially extends as the susceptibility difference is increased.

