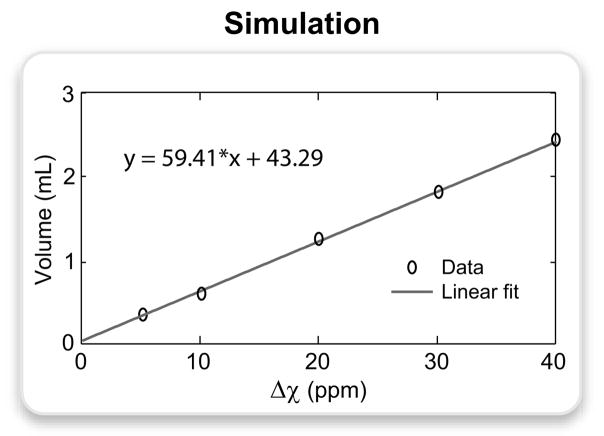
Figure 5.
The volume of hyperintense signal was measured on the simulated images of the spherical perturber (0.7-mm resolution) for the following Δχ values: 5, 10, 20, 30, 40 ppm. Bivariate Gaussian noise was added to the data to achieve an SNR of 20, and the signal was thresholded at 3 standard deviations above the mean background signal. The plot displays the actual data points and the corresponding linear fit expressed by the following equation: y = 59.41 · x + 43.29, where y is the volume of positive contrast in μL, and x is the susceptibility difference in ppm.

