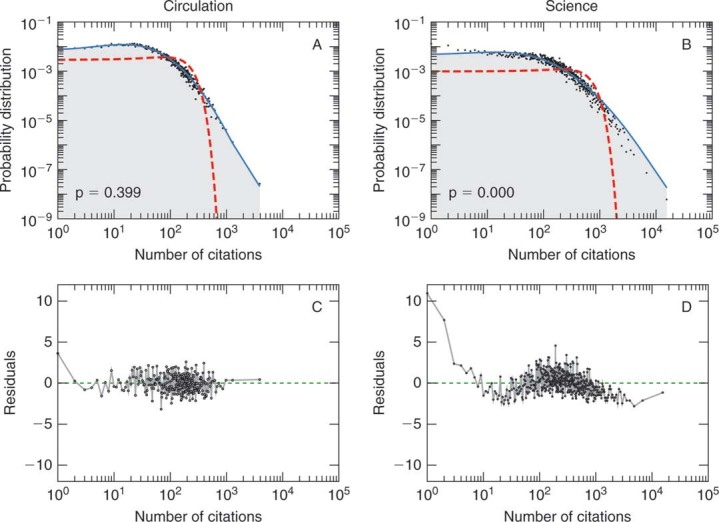
Figure 2.

Goodness of fit of latent normal model to journal citation distribution data.
A, Comparison of the model to data for articles published in the steady state period (1970–1998) for the journal Circulation. We can not reject hypothesis H1 (p1=0.4). B, Plot of residuals,  against the independent variable, n for the journal Circulation. For journals where hypothesis bf
H1 cannot be rejected (p
 > 0.05), the residuals are uncorrelated with the number of citations. C, Comparison of the model to data for articles published in the steady state period (1996–1998) of the journal Science. In this case, p1 is near zero, indicating that we can reject hypothesis H1 with high confidence. D, Plot of residuals,
  against the independent variable, n for the journal Science. For journal where hypothesis H1 is rejected (p
 < 0.05), the residuals are correlated. In this particular case, the model under-predicts the number of uncited articles. Whereas for the “true” model of all journal citation distributions, we would expect 5% (109) of the journals to yield p
 > 0.05, we observe that 10% (229) of the journals yield p
 > 0.05. For the purpose of comparison, the dashed lines in A and C indicate best fit normal distributions.
