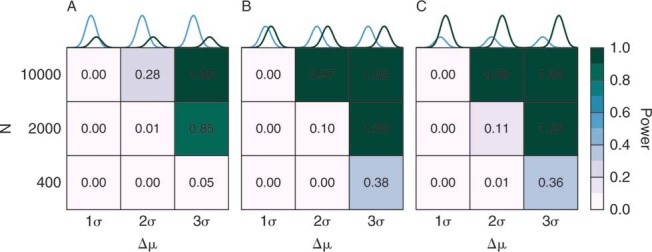
Figure 5.

Power analysis of our testing procedure. We draw data from a mixture of two normal distributions with different means but identical variance. 25% (A), 50% (B), and 75% (C) of the points in these samples were drawn from the normal with the largest mean. Nsample is the number of data points in each sample considered and Δμ is the difference in the means of the distributions. The power of the testing procedure depends on both the specific nature of the deviation from the null hypothesis and the number of points in the dataset. It is clear that a distribution that results from a mixture of lognormal distributions that are separated by only one standard deviation are essentially impossible to detect.
