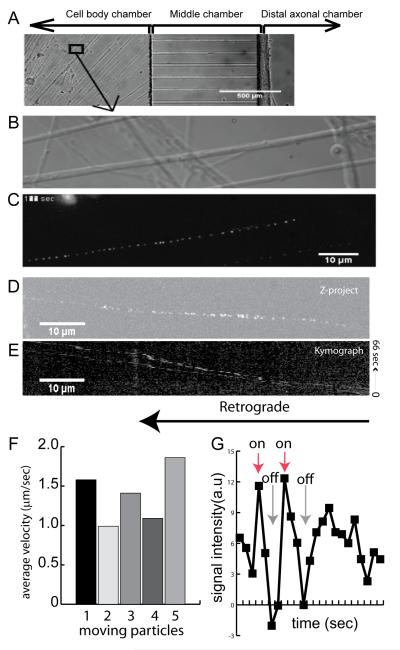
Figure 4.
Single molecule imaging of transport of mBtNGF-QD655 in axons of dorsal root ganglion (DRG). A: A phase contrast image of DRG neurons that were cultured in the microfluidic chambers. Following addition of 0.2 nM mBtNGF-QD655 to the distal axons, real time imaging of transport of mBtNGF-QD655 within the proximal axons was carried out using a 100x oil objective lens. A high resolution DIC image of proximal axons of DRG neurons is shown in B. Time-lapse trajectory of mBtNGF-QD655 movement within the corresponding axons is shown in C. Kymograph analysis of Movie 2 (supplemental materials) was also performed using ImageJ. The result of Z-project is shown in D and the resulting kymograph is shown in E. F: A histogram shows the average velocities of retrogradely transported endosomes. G: A line graph shows the blinking properties of single QDs. Fluorescence intensity of a moving particle was measured frame by frame. Following background subtraction, the signal intensity displays a pattern of either complete “on” or complete “off”, characteristic of blinking of a single QD, whereas an out-of-focus signal should show a slow drop in fluorescence intensity instead.

