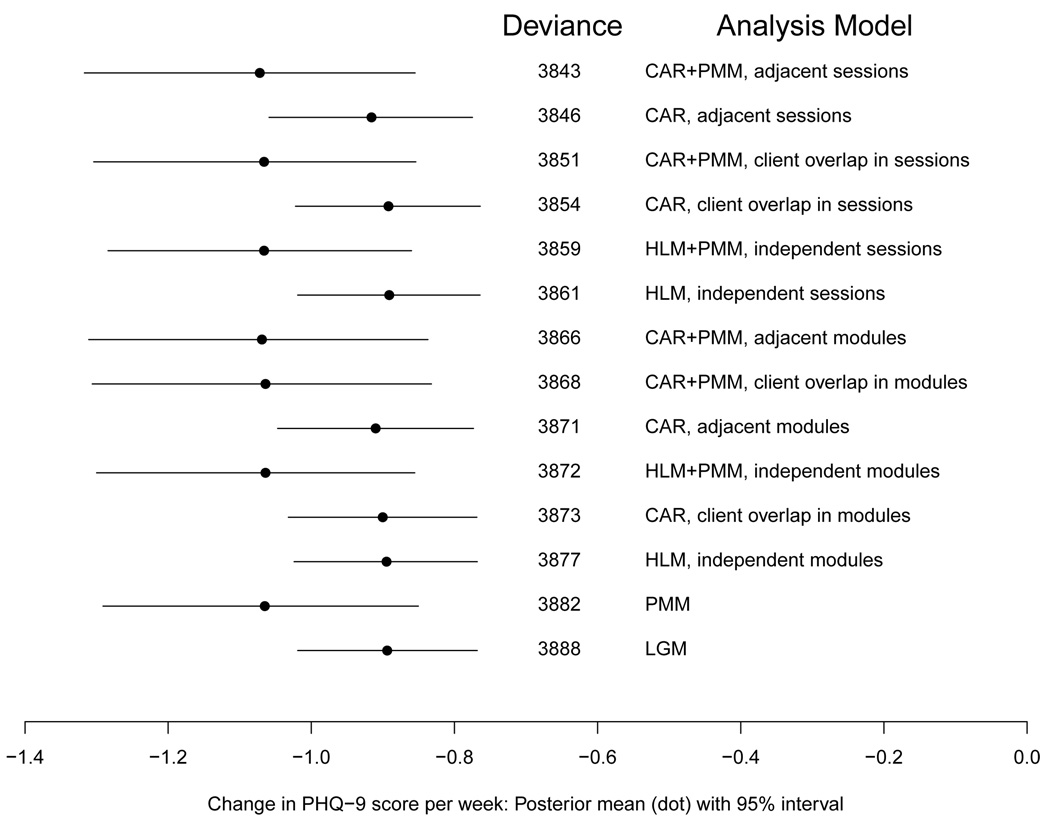
FIG 4.
95% HPD interval for marginal slope parameter, along with posterior mean deviance and analysis model description. Models sorted from lowest posterior mean deviance (indicating better model fit) to highest (indicating worse fit). ‘Closeness’ indicates closeness type for CAR priors and whether ‘session’ or ‘module’ indicates the clustering unit.

