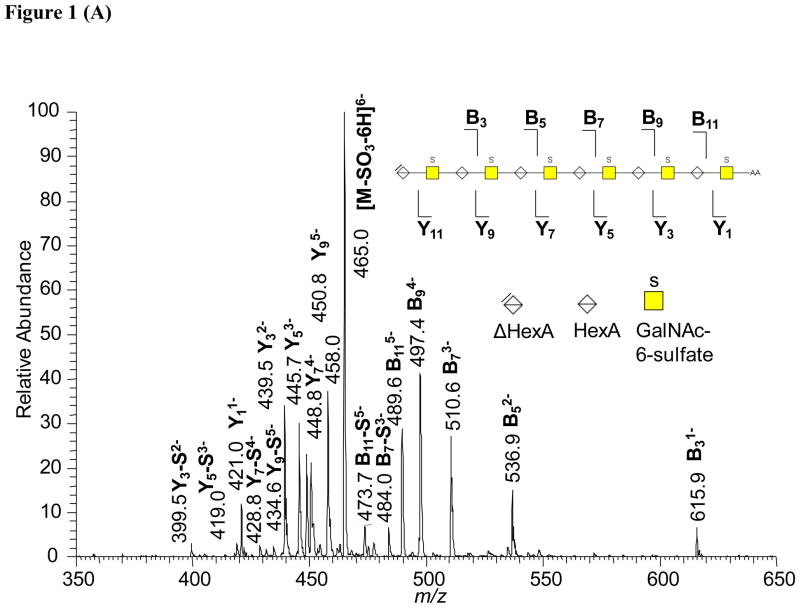
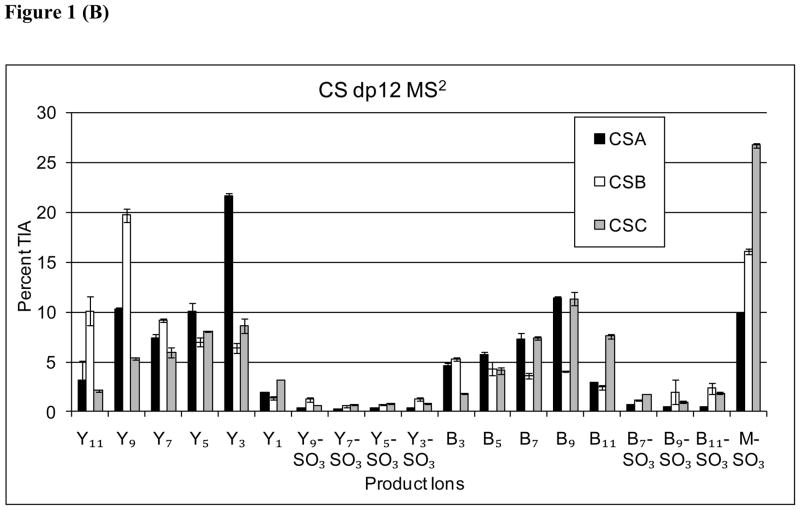
Figure 1.
(A) Representative tandem mass spectrum of 2AA labeled CS: CSC dp12-2AA. The ion at m/z 458 is an internal fragment ion commonly observed for CS oligosaccharides. The inset diagrams the product ions observed. The Y11 is observed as a low abundance ion at m/z 451.8 (not labeled). Loss of SO3 is abbreviated as “S”. (B) Comparison of product ion abundances from CAD tandem MS of Δdp 12-2AA from CSA, CSB, and CSC, respectively. TIA = total ion abundance.


