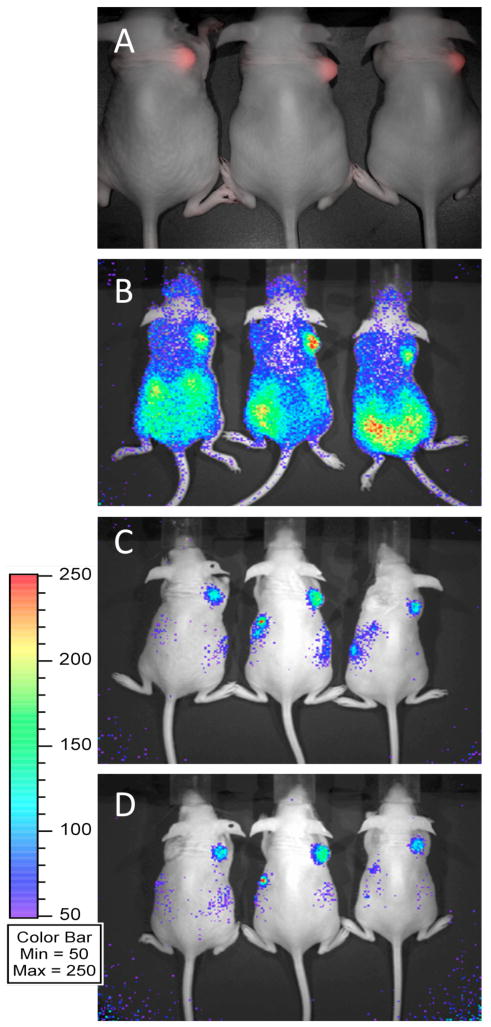
Figure 2.

In vivo imaging of 5b-90Y. (A) Spectrally unmixed fluorescent image (overlaid with the corresponding monochrome image) acquired for three mice, each of which received bilateral injections of 3×10⁶ U-87 glioma cells to the scapular region. Tumors on right shoulders are derived from U-87/DC cells engineered to express DAbR1 and the fluorescent protein mCherry. There are also tumors on the left shoulders, derived from parental U-87 cells without the reporter gene. (B, C & D) Cerenkov luminescence images acquired following tail vein injection of 8 μCi 5b-90Y. The color scale units (common to B, C, & D) indicate counts per pixel. Images were acquired at B) 9 min, C) 1.5 h and D) 3.5 h post-injection. Similar images were obtained for 5a-90Y. The color scale units common to B, C, & D indicate counts per pixel, and correspond to the radiance range 3.4×10³ – 1.7×10⁴ photons/s/cm2/sr.
