
Figure 3.
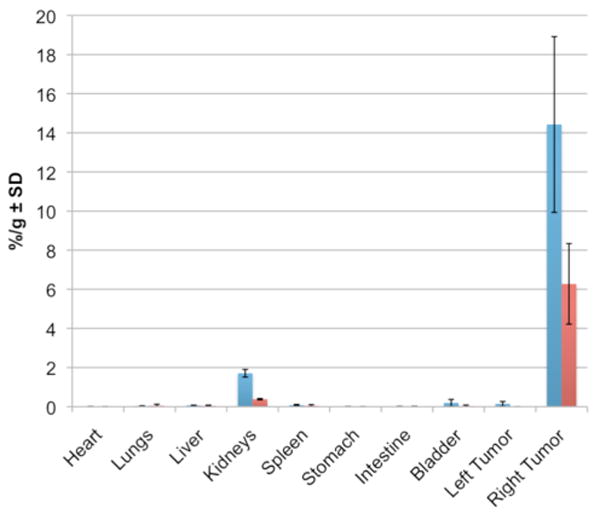
Mouse biodistributions 48 h after injection of 5a-90Y (blue) or 5b-90Y (red). Percent dose per gram tissue ± standard deviation (n=3). See Scheme 1 for structures of 5a and 5b. Right tumor expresses the DAbR1 receptor gene.
Official websites use .gov
A
.gov website belongs to an official
government organization in the United States.
Secure .gov websites use HTTPS
A lock (
) or https:// means you've safely
connected to the .gov website. Share sensitive
information only on official, secure websites.
Mouse biodistributions 48 h after injection of 5a-90Y (blue) or 5b-90Y (red). Percent dose per gram tissue ± standard deviation (n=3). See Scheme 1 for structures of 5a and 5b. Right tumor expresses the DAbR1 receptor gene.