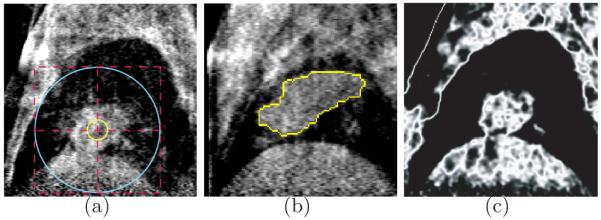
Fig. 4.
(a) One typical example of the initialization step in sagittal view. The yellow sphere lies inside the tumor and the blue sphere completely contains the tumor. The cross point indicates the given center point. (b) The tumor (yellow) lies adjacent to both the diaphragm and the upper boundary of the lung. (c) The cost image for data term of the graph cut energy. The higher intensity value indicates the larger probability that the voxel belongs to the tumor.

