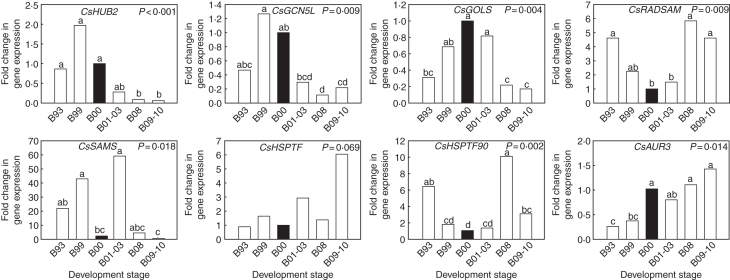
Fig. 3.
Relative gene expression of HUB2, GCN5L, GOLS, RADSAM, SAMS, HSPTF, HSPTF90 and AUR3 during six dormancy stages of C. sativa buds, assessed by real-time RT-PCR. Expression is relative to actin and normalized for stage B00 (highlighted in black; n = 3). Identical letters above the bars indicate no significant differences between stages in a Duncan's multiple range test, following a significant ANOVA test result. Development stages are described in Table 1.

