Fig 5.
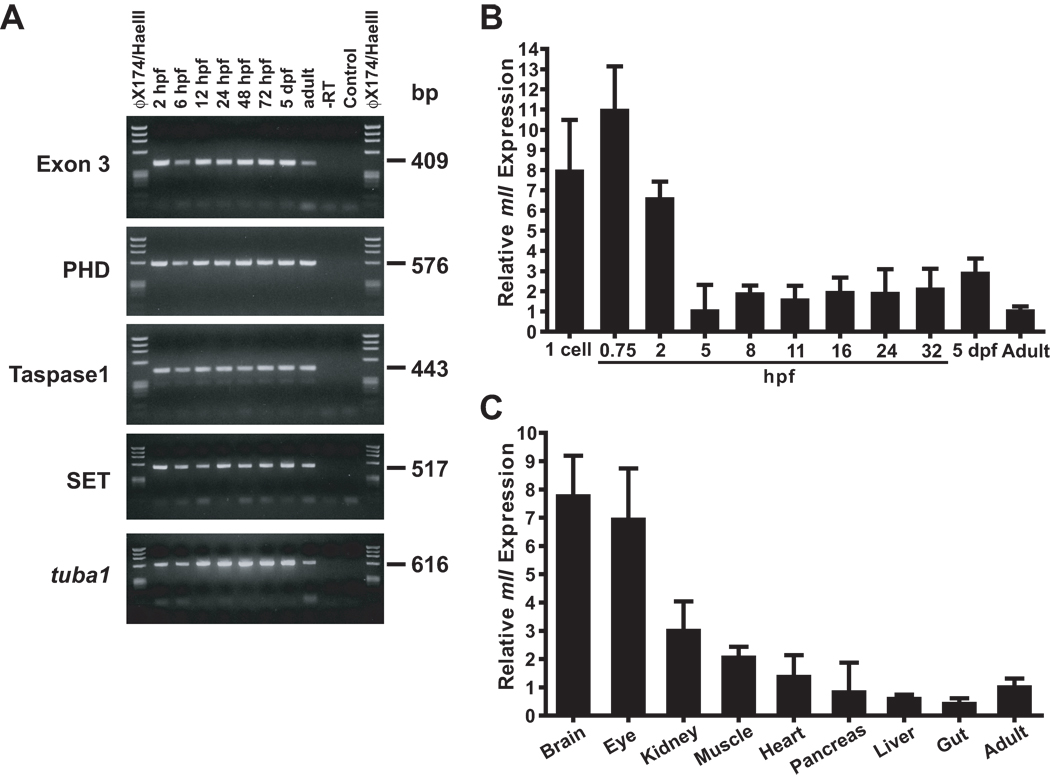
Analysis of mll expression in whole zebrafish and demonstration of enrichment of zebrafish mll expression in haematopoietic tissues. (A) Temporal RT-PCR analysis of zebrafish mll mRNA expression. Developmental timepoints are indicated above each lane; target amplicons are at left. Sequencing confirmed respective transcripts. (B) Q-RT-PCR analysis of developmental mll expression. mll amplicon spanned exons 1–3; bactin1 housekeeping gene target amplicon was exons 4–5. Expression normalized to bactin1 is shown for each timepoint relative to whole adult. Data were analysed using comparative Ct method (Livak and Schmittgen 2001). Results represent 4 experiments per timepoint with 3 replicates per probeset per experiment; error bars represent standard deviation. Abbreviations: hpf, hours post-fertilization; dpf, days post-fertilization. (C) Q-RT-PCR analysis of mll expression in dissected wild-type zebrafish adult tissues. Results represent quadruplicate experiments on RNAs from respective pooled dissected tissues of 3 wild-type adults, and independent quadruplicate experiments on RNAs from respective pooled dissected tissues of 3 more wild-type adults (8 experiments per tissue total). The same probesets were used as in (B). Normalized expression is shown relative to the RNA sample prepared from two whole wild-type adult males and females each. Data were analysed using comparative Ct method (Livak and Schmittgen 2001). Error bars represent standard deviation of all 8 experiments. Note enriched mll expression in the adult kidney.

