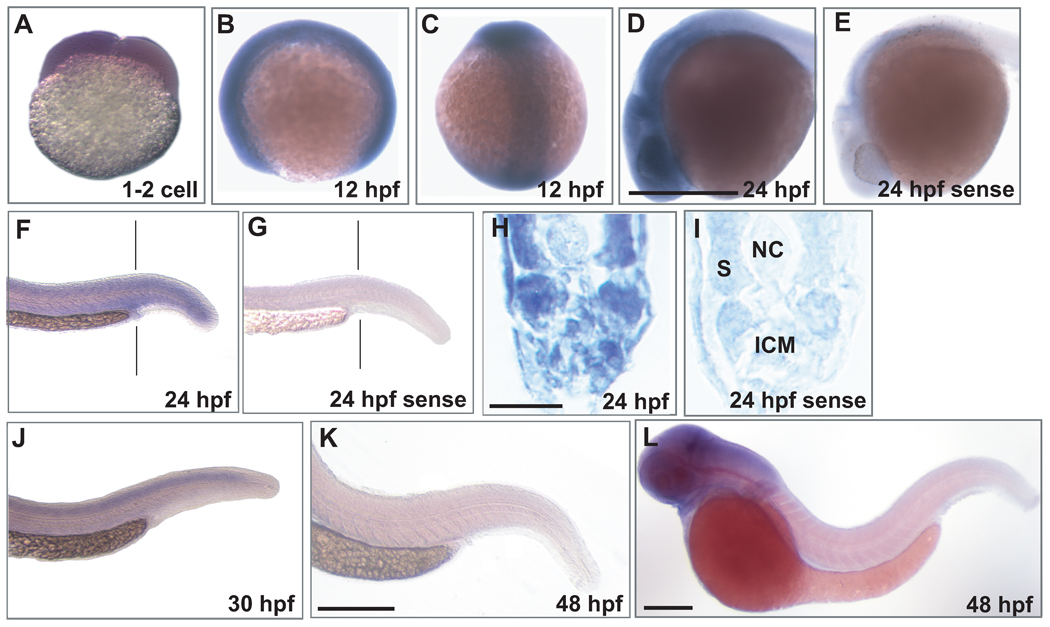
Fig 6.
WISH analysis of mll mRNA expression in wild-type zebrafish embryos. Anti-sense (A–D,F,H, J–L) mll probe, and sense negative control probe (E, G, I) were used; examples of sense control are at 24 hpf. A. At the 1–2 cell stage, each cell is positive, suggesting that mll transcripts are maternally supplied. B, C. At 12 hpf, mll transcripts are ubiquitously expressed throughout the embryo. D. By 24 hpf, mll transcripts are highly expressed in the CNS. F. By 24 hpf, mll transcript expression is lower than at 12 hpf, but is present in peripheral tissues including the ICM (F, vertical line) at lower levels. H. Transverse section (vertical line in F) just posterior to yolk extension showing mll expression at 24 hpf in the posterior ICM and other peripheral tissues. ICM, intermediate cell mass; NC, notochord; S, somite. J. At 30 hpf, mll transcripts still remain highly expressed in the CNS (not shown) but are lower in the tail and in region of ICM. K, L. By 48 hpf, mll expression is not detected in peripheral tissues and is absent from the ICM, although transcripts are still expressed in the CNS. WISH probes from 2 regions of mll (662 base probe from 5’UTR-exon 3; 477 base probe from exon 33-exon 35) gave the same results. Scale bars: D, 500 µm (A–E); H, 20 µm (H, I); L, 500 µm (F, G, J, L); K, 500 µm (K).

