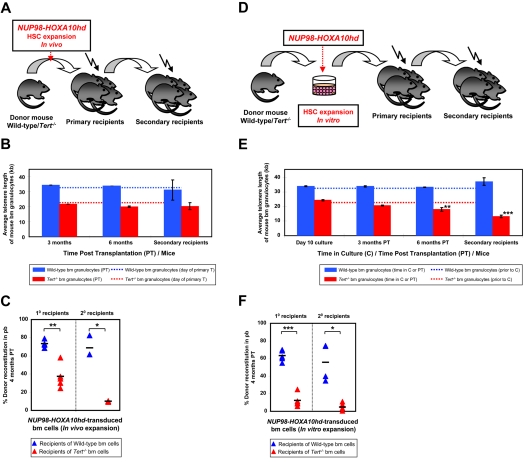
Figure 2.
NA10hd effect on telomere maintenance and reconstitution activity of WT and Tert−/− HSCs. (A) Experimental protocol in which wbm cells from 5-FU pre-treated WT or Tert−/− mice were transduced with NA10hd and transplanted into lethally irradiated primary recipients. Six months later, donor-derived WBM cells from the primary recipients were transplanted into secondary recipients. (B) Average telomere lengths of donor-derived WT (blue bars) or Tert−/− (red bars) BM cells obtained 3 and 6 months PT from the primary recipients and 3 months PT from the secondary recipients. Dotted lines indicate the telomere length of donor WT (blue) or Tert−/− (red) BM cells before infection and primary transplantation. Error bars denote SD. Nwt = 2; 2; 2 and Ntert−/− = 2; 2; 3 at 3- and 6-month PT time point analysis of 1° and 3-month PT time point analysis of 2° recipients, respectively. (C) Percent donor reconstitution in the PB of primary and secondary recipients (generated as described in panel A) transplanted with NA10hd-transduced WT (blue triangles) and Tert−/− (red triangles) BM cells. Statistical significance was determined by application of the paired Student t test and is shown as *P < .05 or **P < .01. Each triangle represents an individual recipient. Each horizontal line represents the mean percent donor reconstitution of at least 3 recipients. (D) Experimental protocol in which WBM cells from 5-FU pre-treated WT or Tert−/− mice were transduced with NA10hd, expanded for 6 days in vitro and transplanted into lethally irradiated primary recipients. Six months later, donor-derived WBM cells from the primary recipients were transplanted into secondary recipients. (E) Average telomere lengths of donor-derived WT (blue bars) or Tert−/− (red bars) BM cells were obtained at the end of expansion in vitro, 3 and 6 months PT from the primary recipients and 3 months PT from the secondary recipients. Dotted lines indicate telomere lengths of donor WT (blue) or Tert−/− (red) BM cells before infection, in vitro expansion and primary transplantation. Error bars denote SD. Nwt = 2; 4; 4; 4 and Ntert−/− = 2; 4; 4; 5 at 10-day time point analysis of cultured cells, 3- and 6-month PT time point analysis of 1° and 3-month PT time point analysis of 2° recipients, respectively. Statistical significance was determined by application of the paired Student t test and is shown as **P < .01 or ***P < .005. (F) Percent donor reconstitution in the PB of primary and secondary recipients (generated as described in panel D) transplanted with NA10hd-transduced and in vitro expanded WT (blue triangles) and Tert−/− (red triangles) BM cells. Statistical significance was determined by the application of the paired Student t test and is shown as *P < .05 or ***P < .005. Each triangle represents an individual recipient. Each horizontal line represents the mean percent donor reconstitution of at least 3 recipients.

