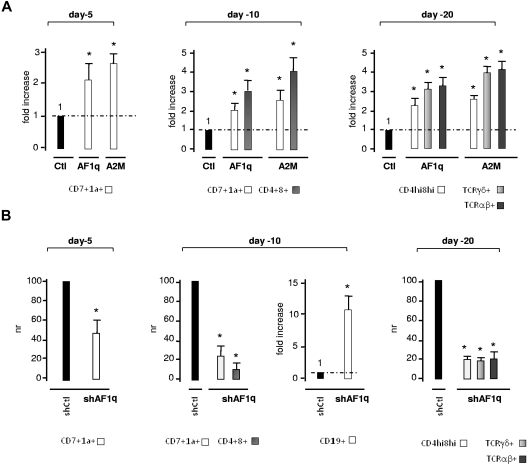
Figure 3.
Effect of AF1q on the kinetics of T-cell development in OP9-DL1 cell cocultures. (A) Forced expression of AF1q promotes T-cell development. CD34+CD45RA−Lin− HPCs transduced with AF1q, A2M, or the empty vector (Ctl) were sorted based on GFP expression and cultured onto OP9-DL1 cells with SCF, FLT3L, and IL-7. GFP+ cells were FACS analyzed at the indicated time points for determining the percentages of CD7+CD1a−, CD7+CD1a+, CD4+CD8+, CD4+CD8hi, TCRαβ+, and TCRγδ+ cells. Results are normalized relative to percentages in cultures of empty vector–transduced cells (Ctl), and are presented as -fold increases. Means ± SD percentages of 4 independent experiments are shown. Statistically significant differences (P < .05; Student t test) between AF1q/A2M and the control conditions are marked by asterisks. Note that AF1q/A2M did not significantly affect overall cell yields (data not shown). The corresponding dot-plot analyses are shown in supplemental Figure 5A. (B) AF1q deficiency impairs T-cell development. CD34+CD45RA−Lin− HPCs transduced with vectors driving the expression of AF1q-specific shRNA54 (shAF1q) or scrambled shRNAs (shCtl) were seeded onto OP9-DL1 cells, cultured, and processed as described. Results are normalized relative to percentages in cultures of cells transduced with scrambled shRNAs (shCtl), and are presented as normalized ratios (NR) or -fold increase. Means ± SD percentages of 4 independent experiments are shown. Statistically significant differences are indicated. Dot-plot analyses are presented in supplemental Figure 5B. Note also that AF1q deficiency does not affect cell proliferation (data not shown).

