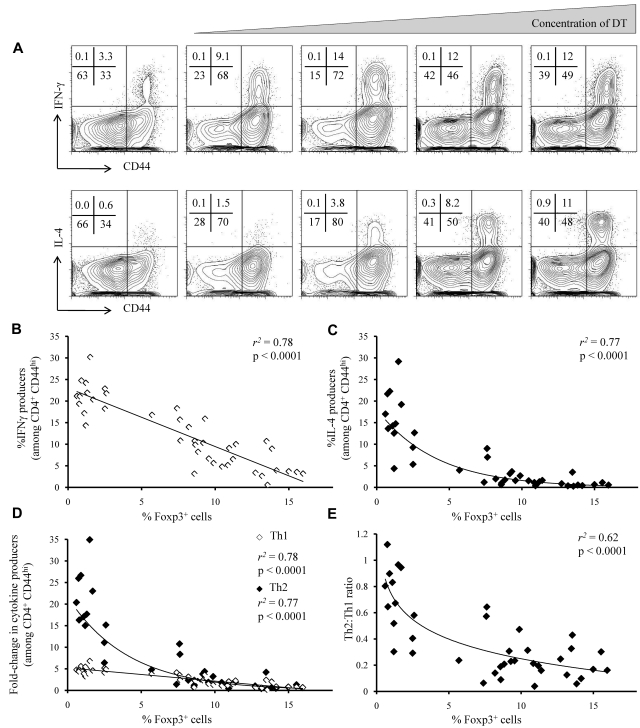
Figure 2.
Asymmetric accumulation of Th1 and Th2 cells after titrated Treg depletion. Effector CD4+ T cells from the lymph nodes of DT-treated Foxp3DTR mice were assessed for the production of IFNγ and IL-4. (A) Representative flow cytometric profiles showing staining for CD44 and IFNγ (top) and CD44 and IL-4 (bottom), by CD4+ Foxp3− T cells. Numbers at the top left of each panel represent the percentage of cells in each quadrant. (B-C) The relationship between Treg frequency and (B) IFNγ production or (C) IL-4 production by CD4+CD44hiFoxp3− T cells. (D) The relationship between Treg frequency and the fold-change in IL-4 (◊) and IFNγ (♦) production by CD4+CD44hiFoxp3− T cells (relative to untreated controls). (E) The relationship between Treg frequency and the IL-4+(Th2)/IFNγ+(Th1) ratio. (B-E) Diamonds represent individual mice, and the trend line represents the optimal model for relationship fitting with the use of the least-squares approach. r2 values are the goodness of fit, and P values show significance of a nonzero relationship.

