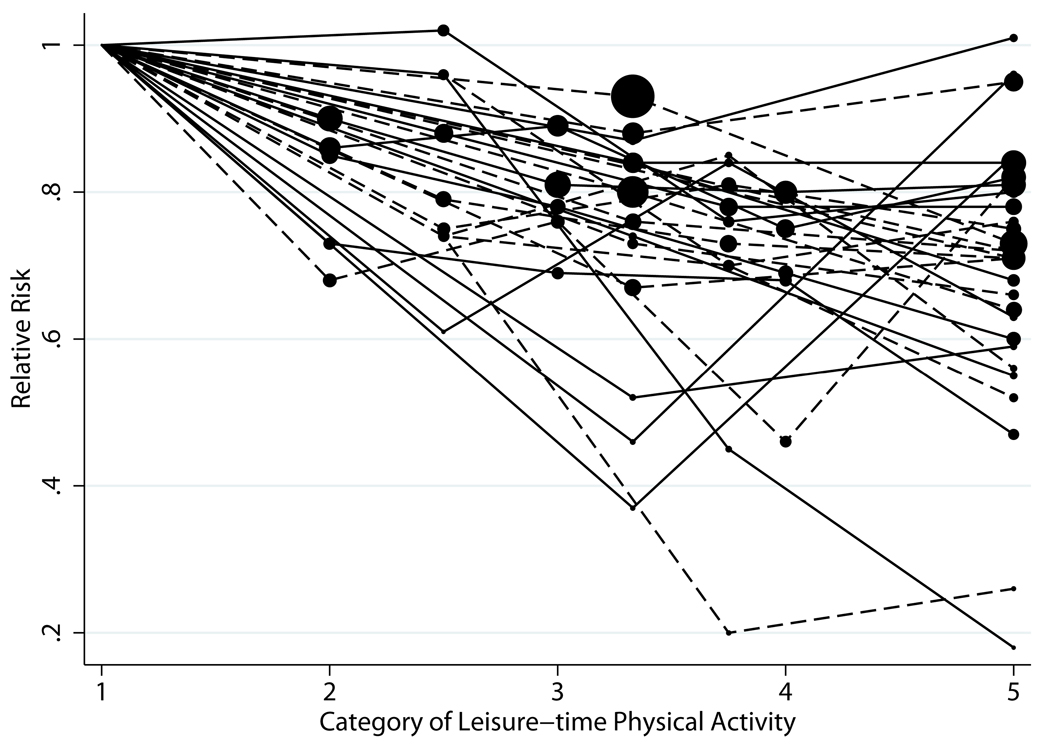
Figure 1.
Plot of Relative Risks of CHD by Category* of LTPA
*All study categories were standardized to five categories for ease of comparison. The size of the data point corresponds to the study size; the larger the dot, the larger the sample size.
| Dashed lines | Studies with physical activity categorized quantitatively |
| Solid lines | Studies with physical activity categorized categorically |

