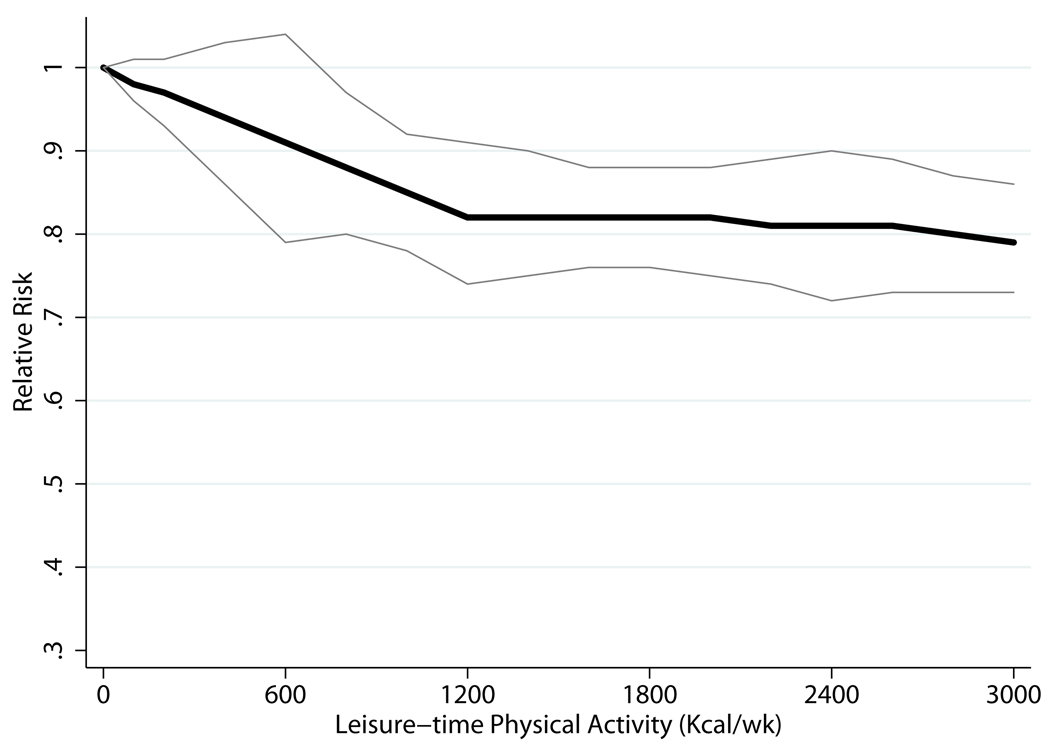
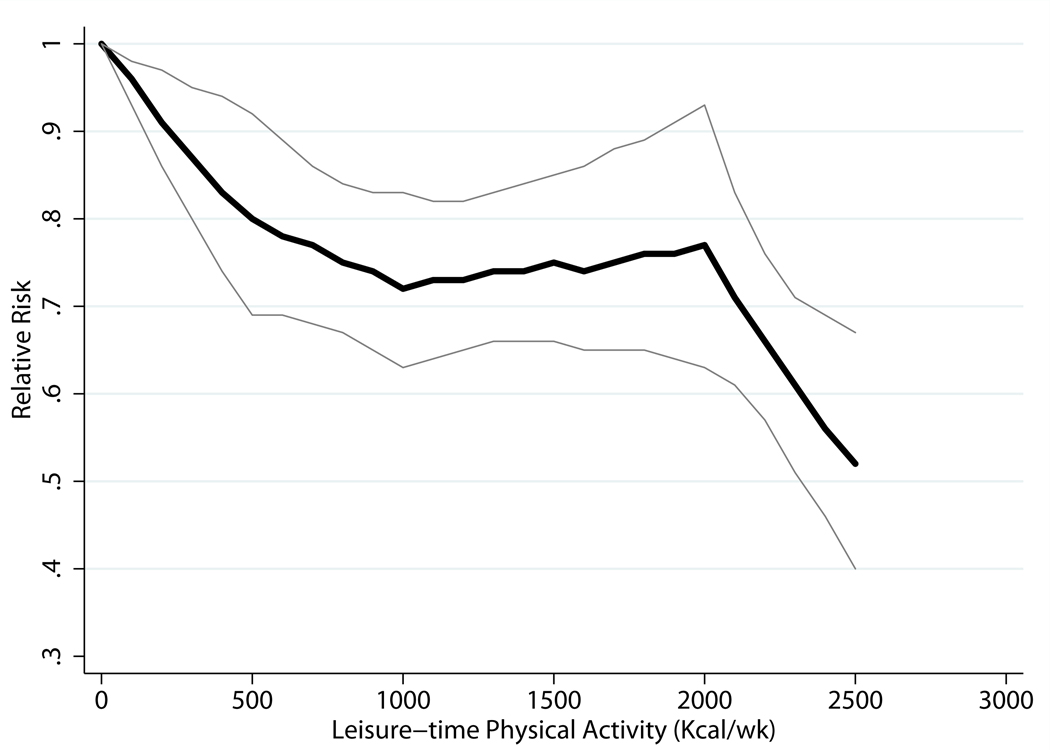
Figure 3.
| Men | Women | ||
|---|---|---|---|
| Kcal/wk* | Relative Risk (95% CI) | Kcal/wk | Relative Risk (95% CI) |
| 600 vs.0 | 0.91 (0.79, 1.04) | 5001 vs.0 | 0.80 (0.69, 0.92) |
| 1200 vs.0 | 0.82 (0.74, 0.91) | 10002 vs.0 | 0.72 (0.63, 0.83) |
| 2400 vs.0 | 0.81 (0.73, 0.90) | 2000 vs.0 | 0.77 (0.63, 0.93) |
| 3000 vs.0 | 0.79 (0.73, 0.86) | 2500 vs.0 | 0.52 (0.40, 0.67) |


