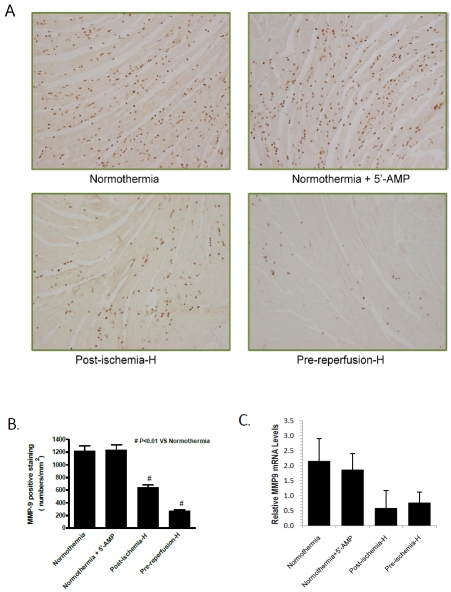
Figure 3.
AIH reduces MMP-9 expression in the infarcted area. (A) A representative immunocytochemical stain is shown for each experimental group. Samples were analyzed at 24 h post-reperfusion after 45 minutes LAD ischemia (magnification, x100). (B) Quantification of MMP-9 positive-stainingceiis in each of the experimental groups. Data are presented as mean cell numbers per squared millimeter ± SEM; n = 8 for each group. #, P < 0.01 compared with the normothermia group. Error bars indicate SEM, (n=8). (C). MMP-9 levels measured by qPCR analysis. Internal control was GAPDH transcript level. Error bars indicate SEM, (n=5).

