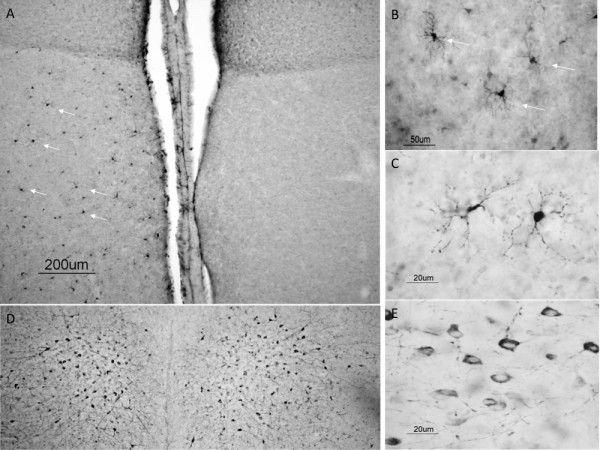
Figure 5.

Representative sections from male zebra finches for aromatase immunoreactivity (Arom-ir) following exposure to PHA and saline. (A) Low power magnification of Arom-ir following exposure to PHA (left) and saline (right). (B) Higher power magnification of Arom-ir cells after exposure to PHA. (C) High power magnification exhibiting the typical cellular morphology and structure of Arom-ir cells following exposure to PHA. (D) Control section showing that normal Arom-ir is not affected by treatment with PHA (left) or saline (right). (E) High power magnification showing neuronal expression of aromatase.
