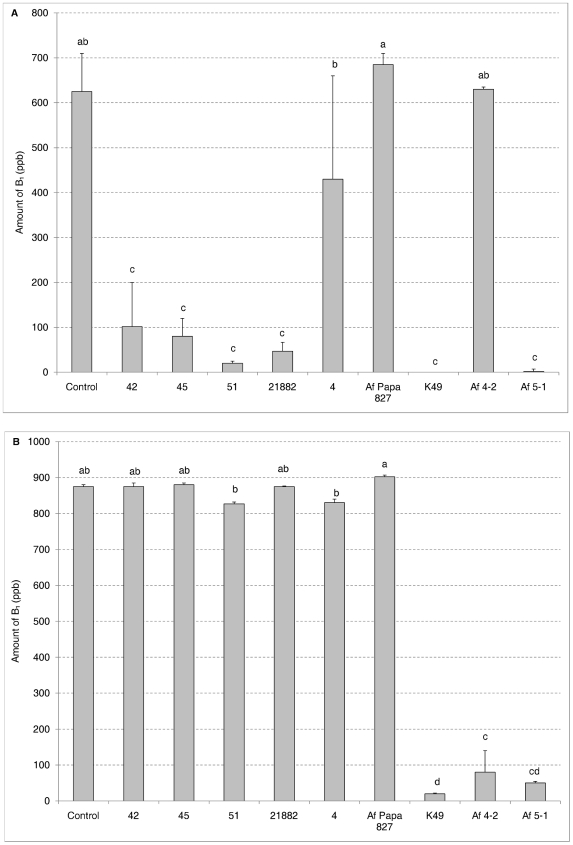
Figure 3. Specificity in intraspecific aflatoxin inhibition.
Aflatoxin B1 production by toxigenic isolates 53 (A) and Af70s-GFP (B) after 5 days incubation in the plate well system mixed (50∶50) with nine different atoxigenic isolates of A. flavus. Error bars represent the standard deviation. Bars with the same letter are not significantly different at the alpha = 0.05 level.

