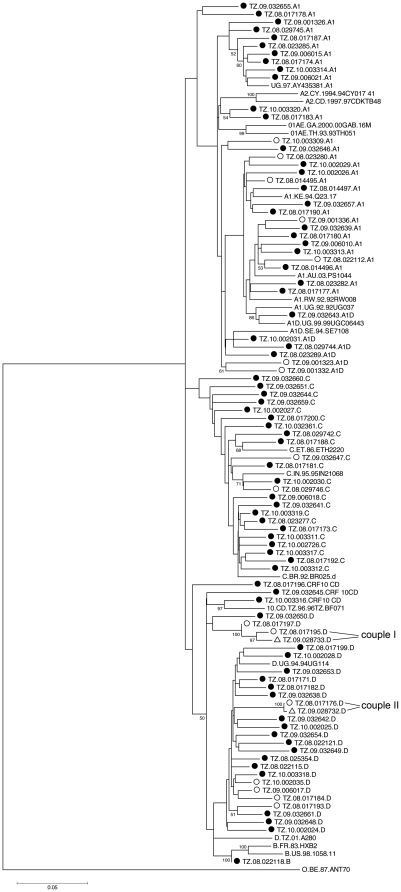
Figure 3. Phylogenetic analysis of RT and PR sequences from the Tanzanian cohort.
A neighbour-joining phylogenetic tree [30] was constructed from the 88 patient derived HIV-1 sequences from the Tanzania cohort and the two partner-derived sequences. Reference sequences were obtained from the Los Alamos HIV sequence database. The analyzed 1302 bp region includes the complete Protease and Reverse Transcriptase coding region. The tree was constructed using Mega software version 4, and the evolutionary distances were calculated using the Kimura 2-parameter method. The bootstrap consensus tree was inferred from 50000 replicates and values greater than 70% are indicated on the branch lengths. The scale at the bottom left indicates the calculated genetic distances between the branches of the phylogenetic tree. Circles represent the 88 samples from our cohort. Black-dotted circles are without RAM, open-circled sequences are with RAM, open triangles are sequences with RAM from HIV-infected partners of two study subjects, which were not included in the determination of HIVDR as these patients received ART. Sequences without symbols are subtype reference sequences derived from Los Alamos database. The subtype is indicated at the end of each sequence name. Relative subtype frequency: A1: 34%, A1D: 7%, C: 26%, CRF10_CD: 4%, D: 28%, B: 1%. Sequences isolated from two couples (couple I, couple II) with NVP resistances.

