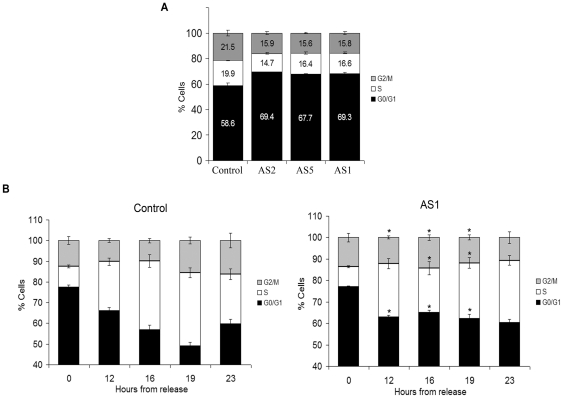
Figure 2. Dp71-depleted cells display altered cell cycle profile and delayed G1-S transition.
Control and Dp71-knockdown cells (clones AS1, -2, and -5), cultured for 48 h, were fixed and stained with propidium iodide. DNA content was analyzed by flow cytometry to obtain cell percentages at each cell cycle phase with the use of ModFif software (A). Control and AS1 cell cultures were synchronized at G0/G1 cell cycle phase by serum starvation for 48 h and then released into the cell cycle. At the indicated times, the cells were fixed and progress of the cell division cycle was analyzed by flow cytometry (B). Cell content (%) at each cell cycle phase is shown. Data are expressed as mean ± standard error of mean (SEM) of three independent experiments. Asterisks denote significant differences (p<0.05) between the respective phases of AS1 and control cells.

