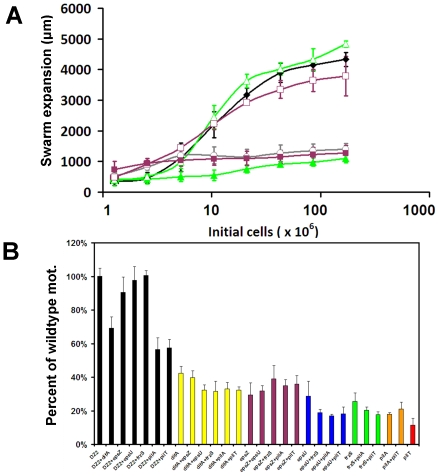
Figure 8. Pathway analysis.
(A) Quantitative S-motility assay examining wildtype (black ♦), frzS (green ▴), wildtype+frzS (green ▵), epsZ (purple ▪), wildtype+epsZ (purple □ ) and epsZ+frzS (gray ○). (B) Combinatorial quantitative social motility analysis of DZ2, difA, epsZ, epsU, frzS, pilA, and pilT strains. Mono-culture and co-culture combinations of these strains are shown, indicating that frzS, epsZ, and epsU are in the same functional pathway as they are both complemented by the presence of wildtype, but are not able to complement each other.

