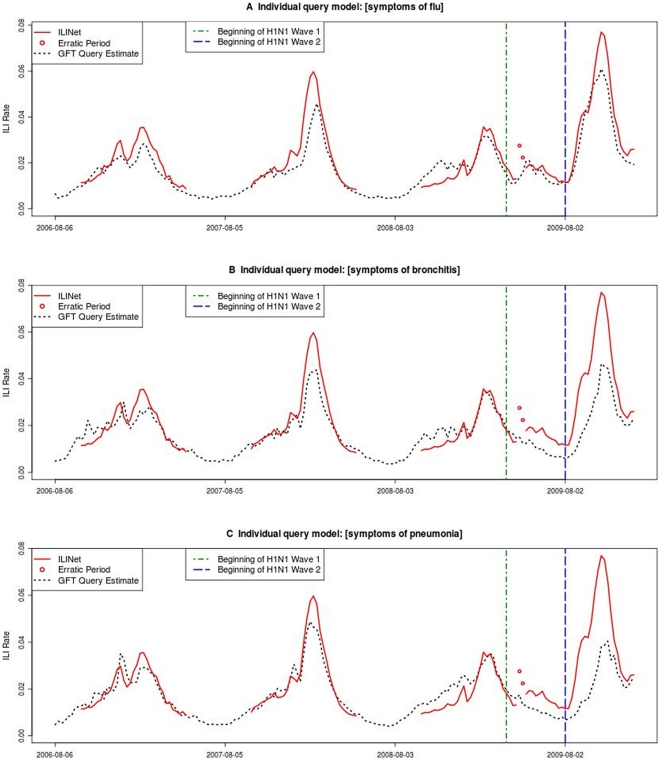
Figure 3. Time series plots of ILINet data and query-level GFT estimates.
Query-level estimates are created by applying the GFT methodology to the search activity for a single query. A) ILINet data and GFT estimates based on the query [symptoms of flu]. B) ILINet data and GFT estimates based on the query [symptoms of bronchitis]. C) ILINet data and GFT estimates based on the query [symptoms of pneumonia].

