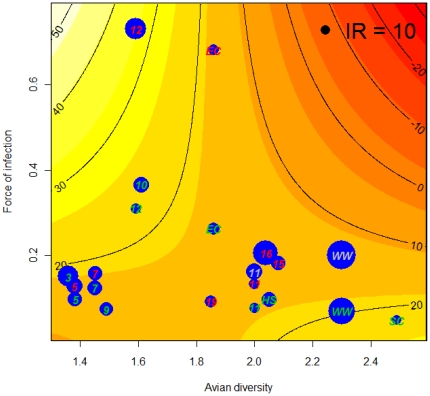
Figure 3. Model and data depicting the interaction between host community force of infection and avian diversity (Shannon index).
Colors represent model expected values for the infection rate, IR (indicated by the contour lines); blue dots represent the IR estimates from the mosquito pools (dot size is proportional to IR magnitude, for reference the black dot on the top right corner represents an IR = 10). Site identification code is indicated on top of each IR estimate and color indicates the year of the estimate (green = 2005, red = 2006, gray = 2007).

