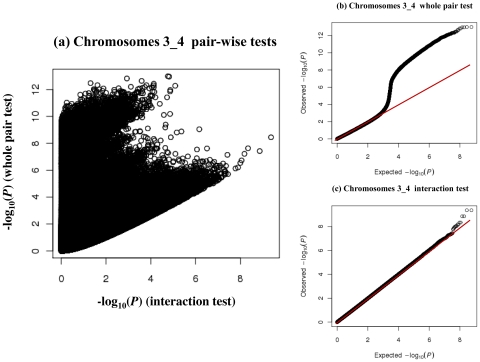
Figure 1. Plots of the P values of the pair-wise tests performed on chromosomes 3 and 4.
SNP combinations with missing joint genotype classes were excluded. Left: scatter plot of the −log10Ppair against −log10Pint values of each SNP pair. Upper-right: QQ plot of the whole pair tests. Lower-right: QQ plot of the interaction tests.

