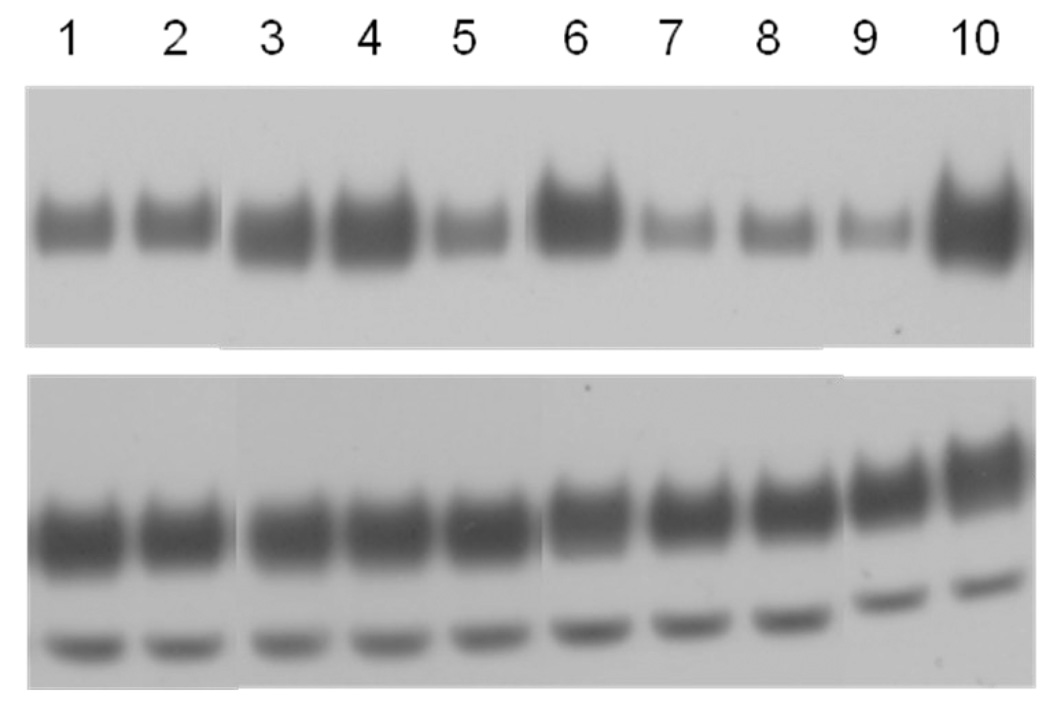
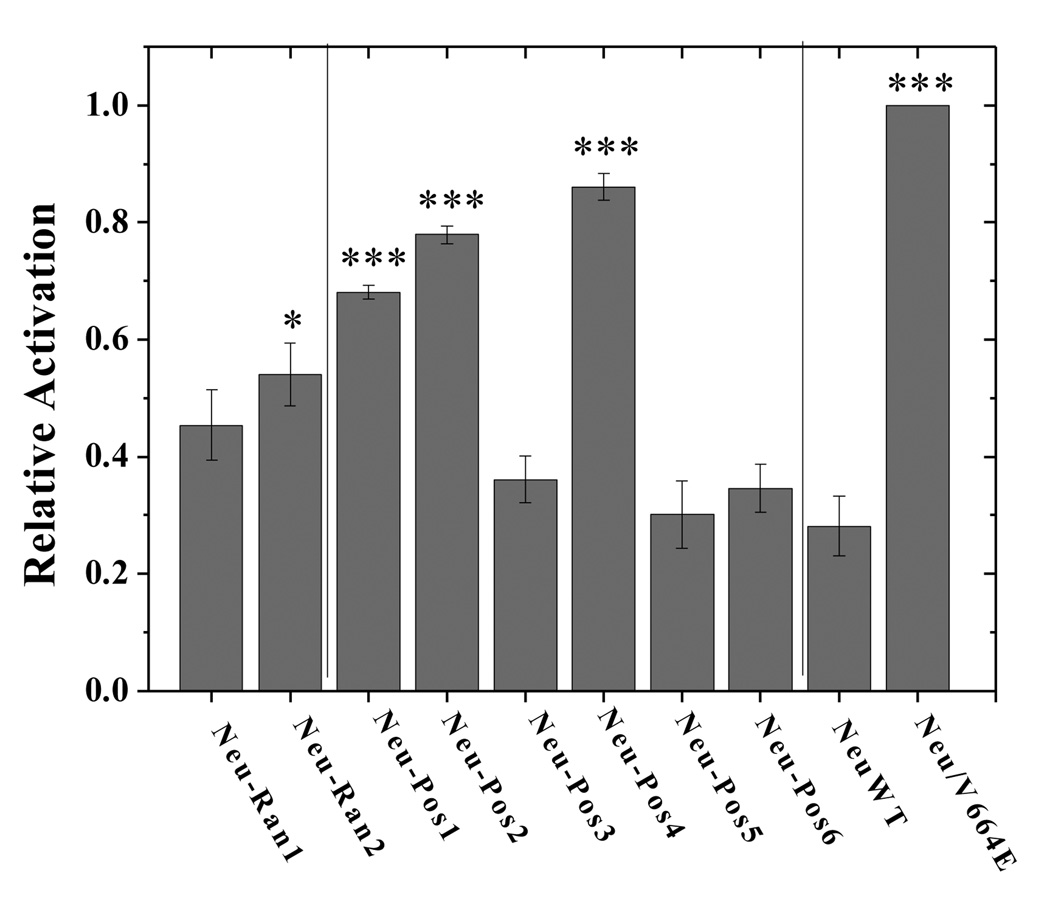
Figure 5.
A. Western blot results. Western blots showing staining intensities of anti-Neu antibodies (reporting on Neu expression) and anti-P-ErbB2 antibodies (reporting on Neu activation) for Neu/WT, Neu/V664E and the eight chimeric Neu receptors. 1:Neu-Ran1; 2:Neu-Ran2; 3:Neu-Pos1; 4:Neu-Pos2; 5:Neu-Pos3; 6:Neu-Pos4; 7:Neu-Pos5; 8:Neu-Pos6; 9:Neu/WT; 10:Neu/V664E.
B. Quantification of Western blots. The Western blots, such as the one shown in Figure 5A, were quantified with ImageQuant TL. The activation level of each receptor is obtained from the ratio of the phosphorylated Neu staining intensity to the total Neu staining intensity. The activation levels were normalized to that of Neu/V664E. A one-factor ANOVA test was used to compare the relative activation levels measured for the various Neu chimeras, and the Tukey-Kramer test was used for pairwise comparisons. The chimeric receptors labeled with * have significantly higher activation than Neu/WT (p<0.05) and those labeled *** exhibit highly significant differences (p<0.001).


