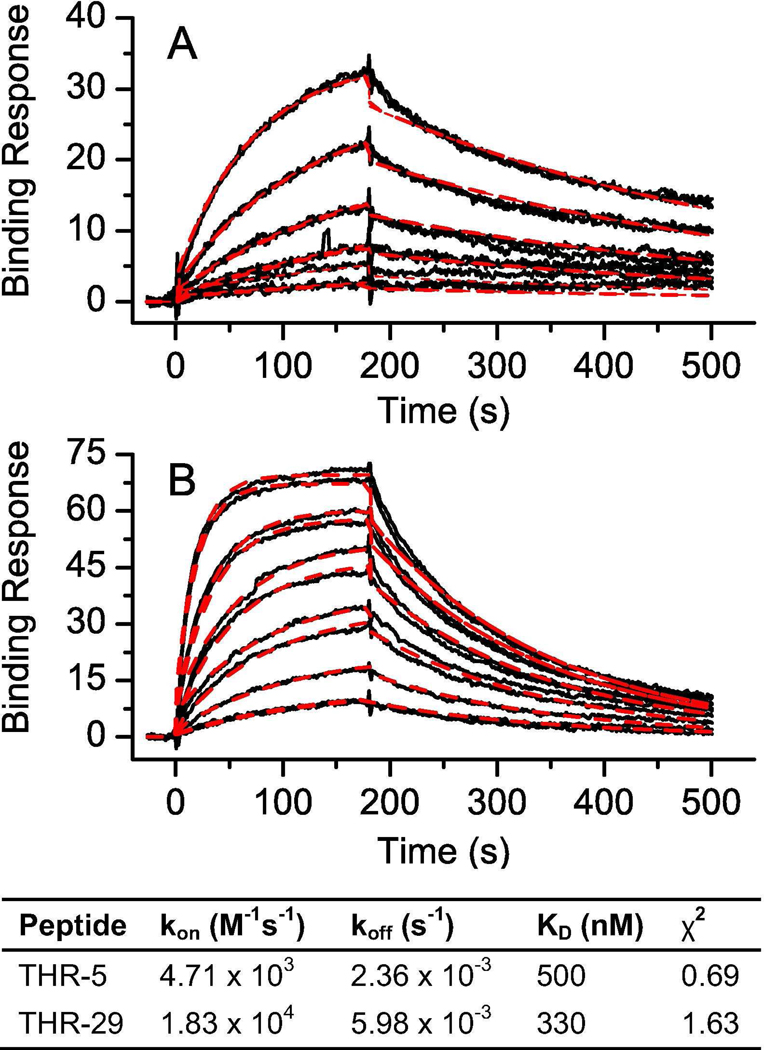
Figure 4.
Measurement of thrombin-binding knottin affinity. Response curves were measured using surface plasmon resonance for A) THR-5 and B) THR-29 binding to thrombin immobilized on a CM5 chip. The raw data are shown as a solid black line with the fit (1:1 Langmuir binding model) as a dashed red line. A two-fold dilution series from 78 nM to 2.5 µM was used for each of the peptides with each series run in duplicate. The kinetic values calculated from each of the fits (association rate constant, dissociation rate constant, and KD) are given.

