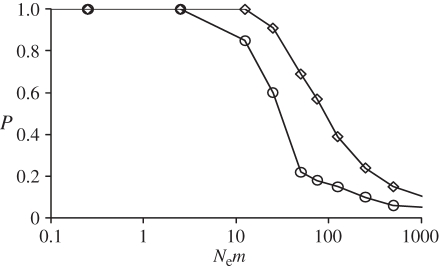
Figure 3.
Power of the exact G-test of heterogeneity of genotypic frequencies, as computed in Genepop 4.0 [33], for detecting two populations exchanging migrants at a rate m. The statistical power P = 1 − β, with β the type II error (see text for more details). Circles represent pairwise comparisons (one sample per population) and diamonds represent global comparisons on 12 samples (six per population). The model considers two populations exchanging migrants at a rate m and of equal effective size Ne. One hundred simulated genotype datasets were generated for each value of m. Simulated datasets contain samples of 29 diploid individuals genotyped at seven independent microsatellite loci. The population-scaled mutation rate Θ = 4NeμR was set to 100. The null allele frequency values were similar to those observed on average for C. terminifera microsatellite markers (i.e. 0.19). See text and electronic supplementary material for more details.

