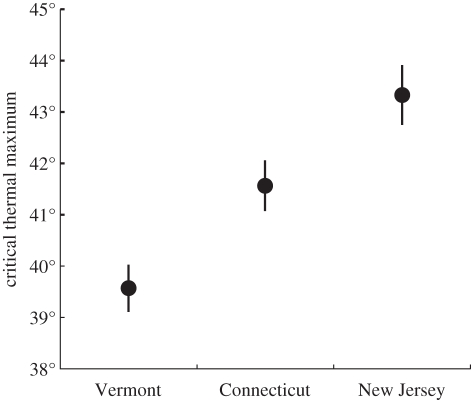
Figure 1.
Critical thermal maximum differed among spiders from different study sites. Spiders from warmer locations continued to respond to stimuli at higher temperatures than spiders from cooler locations (two-way ANOVA F2,84 = 13.45, p < 0.001, Tukey test all p's < 0.05). Points represent mean ± s.e.

