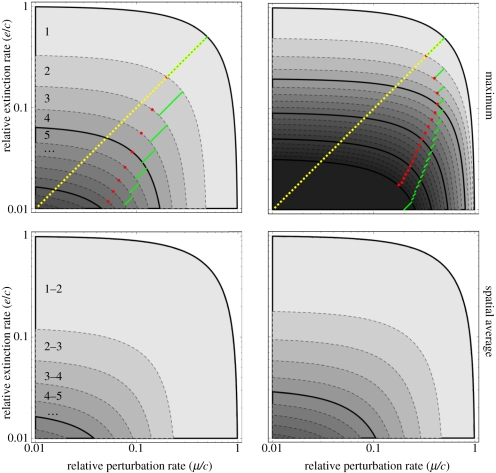
Figure 1.
The effect of perturbation (μ) and extinction (e) in limiting food chain length. Remember that perturbation is the simultaneous eradication of all trophic levels in a patch; while extinction occurs by definition independently at different trophic levels. Darker shades of grey indicate that longer food chains can persist (white, no species persists as μ + e > c). Upper graphs, maximum food chain length; lower graphs, spatially averaged food chain length. Left-hand graphs no habitat selection (φ = 0) and right-hand graphs perfect habitat selection (φ = 1). Yellow lines indicate where μ = e. Green lines indicate where the top trophic level experiences extinction rate equal to the perturbation rate. Red dots represent values where food chain length is limited equally by perturbation and extinction, i.e. it takes exactly the same relative increase of μ or e to reduce chain length by one. Other parameters: eTD = cTD = 0.

