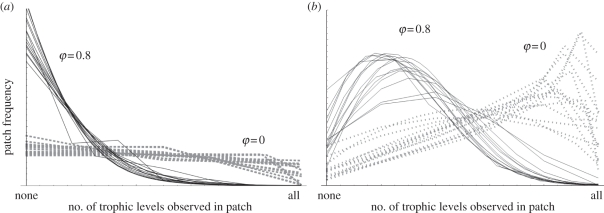
Figure 2.
The distribution of patch types when food chain length is limited primarily by (a) perturbation or (b) extinction. The number of trophic levels present in a patch (i) was standardized between 0 and its regional maximum, while patch frequency (pi) was normalized so that the area below each curve is one. In each panel two sets of curves are shown: 15 with no habitat selection (φ = 0) and 15 with φ = 0.8. Curves correspond to random parameters drawn uniformly in (0.08, 0.5) for μ, in (0.001, 0.1) for e, in (−e, e), for eTD for (−1, 0.2), for cTD and in (10−5, 10−3) for δ, except that e (μ) was fixed to zero in a.

