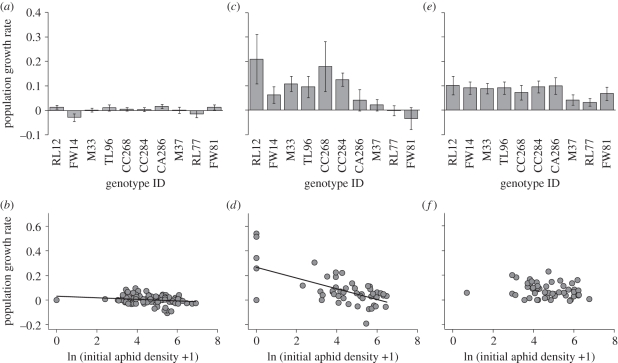
Figure 5.
Population growth rates in the mixture experiment. Mean population growth rates on genotypes are presented in (a) the single-genotype treatment, (c) mixed-genotype treatment and (e) mixed-genotype-with-cage treatment. Plants are ordered the same as figure 2. Error bars indicate s.e. On (b,d,f), relationships between initial densities and population growth rates in the single genotype, mixed genotype, and mixed-genotype-with-cage treatment are presented, respectively. Each point indicates the value on each plant individual. Solid lines indicate significant regression (b: r2 = 0.035, y =−0.006x + 0.030, p = 0.039; d: r2 = 0.36, y =−0.044x + 0.266, p < 0.0001). In the mixed-genotype-with-cage treatment, there was no significant relationship (e: r2 = 0.04, p = 0.17).

