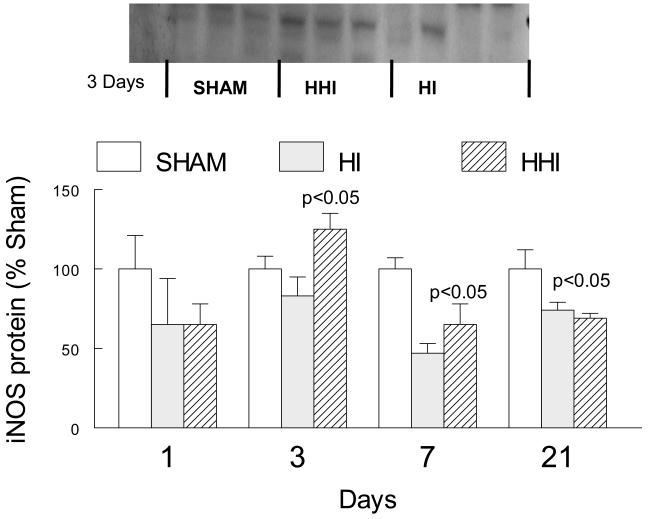
Figure 5.
Increased ipsilateral cortical levels of iNOS only at 3 days after HHI but not HI normalized to Shams. N = 3 for Sham, HI and HHI. Sham values for each sample normalized to actin protein levels. p values at three days are compared to sham or HI animals, at seven days compared to sham animals, at 21 days both HI and HHI were significantly different from sham animals.

