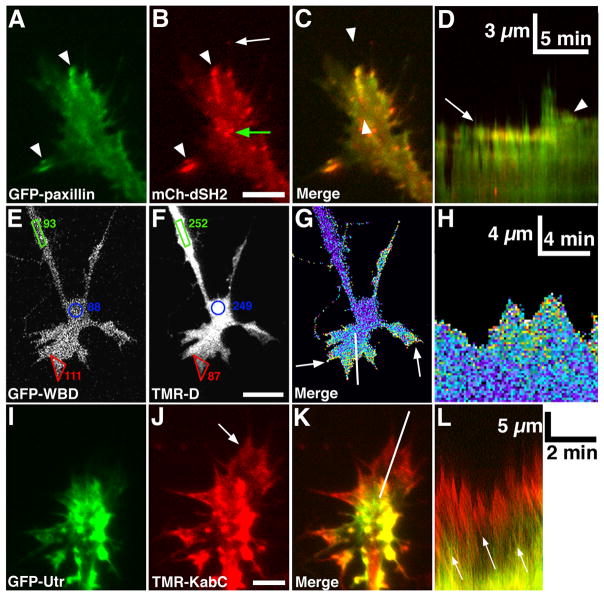
Figure 3. Analysis of cell signaling and structure with live cell imaging.
A, B. Total Internal Reflection Fluorescence (TIRF) microscopy images of paxillin-GFP and mCherry dual-Src homology 2 domain (mCh-dSH2) fluorescent images of a growth cone on PDL-LN. Note that paxillin and phosphotyrosine (PY), as revealed with mCh-dSH2, colocalize at adhesion sites (arrowheads in A, B), whereas the tip of a growing filopodium has PY, without paxillin (arrow in B). C. Merged image of the growth cone in (A, B) shows co-localization at several peripheral adhesions. Note that mCh-dSH2 puncta within the central domain are mobile vesicles (green arrow in B). D. Single line kymograph (see text for details) constructed from region between the arrowheads (C). Note a stable adhesion (arrow) that disassembles after a new protrusion extends forward, followed by the formation of a second adhesion (arrowhead), which stabilizes the receding protrusion. Scale bar, 10 μm in all images and as indicated in kymographs. E, F. GFP-WASP binding domain (GFP-WBD; active Cdc42 binding) and tetramethylrhodamine-dextran (TMR-D; volume marker) fluorescent images of a growth cone on LN captured with a confocal microscope. The average pixel intensities (8-bit scale) within regions at the growth cone periphery (red), central domain (blue) and axon (green) show that GFP-WBD is selectively enriched in the peripheral lamellipodia of this growth cone. G. A pseudo-colored ratio image of the growth cone in (E, F) shows the GFP-WBD/TMR-D ratio is elevated throughout peripheral lamellipodia and filopodia (arrows). H. Single line kymograph constructed from region indicated by the white line in (G). Note an elevated WBD/TMR-D ratio during lamellipodial protrusion. I, J. GFP-Utrophin (GFP-Utr; F-actin probe) and TMR-Kabiramide C (TMR-KabC; F-actin barbed end binding) fluorescent images of a growth cone on PDL-LN collected with a TIRF microscope. Note bright TMR-KabC fluorescence at the periphery (arrow in J), indicating a high concentration of F-actin barbed ends. K. Merged image of the growth cone in (I, J) shows strong co-localization of GFP-Utr and TMR-KabC in central domain foci, but primarily TMR-KabC in the peripheral domain. Weak labeling of peripheral actin with GFP-Utr is consistent with the slow association rate of GFP-Utr onto recently polymerized F-actin (Rybakova et al., 2006). L. Single line kymograph constructed from region indicated by the white line in (K). The slope of the diagonal bands of GFP-Utr and TMR-KabC fluorescence (arrows) indicates a retrograde flow rate of ~ 4 μm/min. Scale bars, 5 μm or as indicated.

